NAV as on 22-09-2025
AUM as on
Rtn ( Since Inception )
14.3%
Inception Date
Dec 05, 2015
Expense Ratio
0.05%
Fund Status
Open Ended Scheme
Min. Investment
5,000
Min. Topup
1
Min. SIP Amount
500
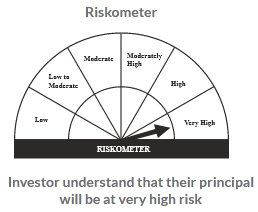
Risk Status
very high
Investment Objective : To generate returns that are commensurate with the performance of the NIFTY 50 Index, subject to tracking error.There is no assurance that the investment objective of the scheme will be achieved.
3 and 6 Months returns are absolute
3 Mon | 6 Mon | 1 Yr | 3 Yrs | 5 Yrs | 10 Yrs | |
---|---|---|---|---|---|---|
Fund | 0.89 | 8.82 | -1.1 | 13.87 | 19.05 | 0.0 |
NIFTY 50 TRI | 0.89 | 8.85 | -1.05 | 13.96 | 19.14 | 13.82 |
ETFs | 4.18 | 12.59 | 6.61 | 18.2 | 19.91 | 13.84 |
Rank within Category | 154 | 140 | 93 | 74 | 30 | |
Number of Funds within Category | 234 | 217 | 192 | 117 | 62 |
Return (%) | ||||||
---|---|---|---|---|---|---|
Scheme Name | AUM (crore) |
Expense Ratio |
1 Yr | 3 Yrs | 5 Yrs | 10 Yrs |
HDFC NIFTY 50 ETF - Growth Plan | 463.02 | 0.05 | -1.1 | 13.87 | 19.05 | 0.0 |
Mirae Asset Hang Seng TECH ETF | 41.7 | 0.56 | 79.59 | 23.56 | 0.0 | 0.0 |
Nippon India ETF Hang Seng BeES | 97.31 | 0.93 | 56.05 | 20.16 | 8.5 | 7.43 |
Mirae Asset NYSE FANG and ETF | 327.17 | 0.65 | 50.54 | 51.98 | 0.0 | 0.0 |
ICICI Prudential Gold ETF | 876.43 | 0.5 | 49.71 | 29.55 | 16.08 | 14.3 |
Aditya Birla Sun Life Gold ETF | 125.26 | 0.47 | 49.66 | 29.46 | 16.05 | 14.46 |
Axis Gold ETF | 206.3 | 0.56 | 49.57 | 29.48 | 16.11 | 14.16 |
HDFC Gold ETF - Growth Option | 1,137.89 | 0.59 | 49.57 | 29.44 | 15.99 | 14.41 |
Mirae Asset Gold ETF | 95.17 | 0.31 | 49.43 | 0.0 | 0.0 | 0.0 |
SBI Gold ETF | 949.94 | 0.7 | 49.4 | 29.32 | 15.94 | 14.35 |
2016 | 2017 | 2018 | 2019 | 2020 | 2021 | 2022 | 2023 | 2024 | 2025 | |
---|---|---|---|---|---|---|---|---|---|---|
Fund | 0.0 | 4.35 | 30.02 | 4.62 | 13.43 | 15.71 | 25.5 | 5.62 | 21.25 | 7.72 |
NIFTY 50 TRI | -3.01 | 4.39 | 30.27 | 4.64 | 13.48 | 16.14 | 25.59 | 5.69 | 21.3 | 7.75 |
Rolling returns are the annualized returns of the scheme taken for a specified period (rolling returns period) on every day/week/month and taken till the last day of the duration. In this chart we are showing the annualized returns over the rolling returns period on every day from the start date and comparing it with the benchmark. Rolling returns is the best measure of a fund's performance. Trailing returns have a recency bias and point to point returns are specific to the period in consideration. Rolling returns, on the other hand, measures the fund's absolute and relative performance across all timescales, without bias.
Company | Holdings (%) |
---|---|
HDFC BANK LIMITED EQ NEW FV RE. 1/- | 13.09 |
ICICI BANK LIMITED EQ NEW FV RS. 2/- | 8.99 |
RELIANCE INDUSTRIES LIMITED EQ | 8.3 |
INFOSYS LIMITED EQ FV RS 5 | 4.78 |
BHARTI AIRTEL LIMITED EQ NEW FV RS 5/- | 4.64 |
LARSEN AND TOUBRO LIMITED EQ NEW FV RS.2/- | 3.81 |
ITC LIMITED EQ NEW FV RE.1/- | 3.44 |
TATA CONSULTANCY SERVICES LIMITED EQ NEW FV RE.1/- | 2.84 |
STATE BANK OF INDIA EQ NEW RE. 1/- | 2.78 |
AXIS BANK LIMITED EQ NE FV RS. 2/- | 2.7 |
KOTAK MAHINDRA BANK LIMITED EQ NEW F.V RS.5/- | 2.6 |
MAHINDRA AND MAHINDRA LIMITED EQ NEW F.V. RS.5 | 2.55 |
HINDUSTAN UNILEVER LIMITED EQ F.V. RS 1 | 2.13 |
Bajaj Finance Limited | 2.1 |
ZOMATO LIMITED EQ | 1.97 |
MARUTI SUZUKI INDIA LIMITED EQ | 1.75 |
SUN PHARMACEUTICAL INDUSTRIES LTD. EQ NEW F.V. RE.1/- | 1.55 |
NTPC LIMITED EQ | 1.4 |
HCL TECHNOLOGIES LIMITED EQ F.V. RS.2/- | 1.39 |
TITAN COMPANY LIMITED EQ NEW Re.1/- | 1.35 |
ULTRATECH CEMENT LIMITED EQ | 1.35 |
TATA MOTORS LIMITED EQ NEW FV RS. 2/- | 1.26 |
BHARAT ELECTRONICS LIMITED EQ NEW FV Re 1/- | 1.19 |
TATA STEEL LIMITED EQ NEW FV RE.1/- | 1.15 |
POWER GRID CORPORATION OF INDIA LIMITED EQ | 1.13 |
TRENT LIMITED EQ NEW FV Re. 1/- | 1.06 |
ASIAN PAINTS LIMITED EQ NEW FV Re. 1/- | 1.03 |
GRASIM INDUSTRIES LIMITED EQ NEW FV RS. 2/- | 0.96 |
BAJAJ FINSERV LIMITED EQ NEW FV RE.1/- | 0.94 |
HINDALCO INDUSTRIES LIMITED EQ NEW FV RE. 1/- | 0.92 |
RELIANCE STRATEGIC INVESTMENTS LIMITED EQ | 0.92 |
JSW STEEL LIMITED EQ NEW FV RE. 1/- | 0.88 |
ADANI PORTS AND SPECIAL ECONOMIC ZONE LIMITED EQ NEW RS. 2/- | 0.87 |
BAJAJ AUTO LIMITED EQ | 0.86 |
TECH MAHINDRA LIMITED EQ NEW FV RS. 5/- | 0.85 |
OIL AND NATURAL GAS CORPORATION LIMITED EQ NEW F.V RS.5/- | 0.82 |
CIPLA LIMITED EQ NEW FV RS.2/- | 0.81 |
COAL INDIA LTD EQ | 0.77 |
EICHER MOTORS LIMITED EQ NEW FV RE. 1/- | 0.76 |
HDFC LIFE INSURANCE COMPANY LIMITED EQ | 0.75 |
Nestle India Ltd | 0.75 |
SBI LIFE INSURANCE COMPANY LIMITED EQ | 0.73 |
Shriram Finance Limited | 0.73 |
APOLLO HOSPITALS ENTERPRISE LIMITED EQ NEW F.V. RS.5/- | 0.69 |
Dr. Reddys Laboratories Ltd | 0.69 |
WIPRO LIMITED EQ F.V. RS. 2 | 0.64 |
TATA CONSUMER PRODUCTS LIMITED EQ NEW F.V. RE.1/- | 0.63 |
HERO MOTOCORP LIMITED EQ FV RS 2 | 0.6 |
ADANI ENTERPRISES LIMITED EQ NEW FV RE.1/- | 0.53 |
INDUSIND BANK LIMITED EQ | 0.44 |
Net Current Assets | 0.12 |
TREPS - Tri-party Repo | 0.01 |
Company | Sector | Holdings (%) |
---|---|---|
HDFC BANK LIMITED EQ NEW FV RE. 1/- | Banks | 13.09 |
ICICI BANK LIMITED EQ NEW FV RS. 2/- | Banks | 8.99 |
RELIANCE INDUSTRIES LIMITED EQ | Petroleum Products | 8.3 |
INFOSYS LIMITED EQ FV RS 5 | IT - Software | 4.78 |
BHARTI AIRTEL LIMITED EQ NEW FV RS 5/- | Telecom - Services | 4.64 |
LARSEN AND TOUBRO LIMITED EQ NEW FV RS.2/- | Construction | 3.81 |
ITC LIMITED EQ NEW FV RE.1/- | Diversified FMCG | 3.44 |
TATA CONSULTANCY SERVICES LIMITED EQ NEW FV RE.1/- | IT - Software | 2.84 |
STATE BANK OF INDIA EQ NEW RE. 1/- | Banks | 2.78 |
AXIS BANK LIMITED EQ NE FV RS. 2/- | Banks | 2.7 |
KOTAK MAHINDRA BANK LIMITED EQ NEW F.V RS.5/- | Banks | 2.6 |
MAHINDRA AND MAHINDRA LIMITED EQ NEW F.V. RS.5 | Automobiles | 2.55 |
HINDUSTAN UNILEVER LIMITED EQ F.V. RS 1 | Diversified FMCG | 2.13 |
Bajaj Finance Limited | Finance | 2.1 |
ZOMATO LIMITED EQ | Retailing | 1.97 |
MARUTI SUZUKI INDIA LIMITED EQ | Automobiles | 1.75 |
SUN PHARMACEUTICAL INDUSTRIES LTD. EQ NEW F.V. RE.1/- | Pharmaceuticals & Biotechnology | 1.55 |
NTPC LIMITED EQ | Power | 1.4 |
HCL TECHNOLOGIES LIMITED EQ F.V. RS.2/- | IT - Software | 1.39 |
TITAN COMPANY LIMITED EQ NEW Re.1/- | Consumer Durables | 1.35 |
ULTRATECH CEMENT LIMITED EQ | Cement & Cement Products | 1.35 |
TATA MOTORS LIMITED EQ NEW FV RS. 2/- | Automobiles | 1.26 |
BHARAT ELECTRONICS LIMITED EQ NEW FV Re 1/- | Aerospace & Defense | 1.19 |
TATA STEEL LIMITED EQ NEW FV RE.1/- | Ferrous Metals | 1.15 |
POWER GRID CORPORATION OF INDIA LIMITED EQ | Power | 1.13 |
TRENT LIMITED EQ NEW FV Re. 1/- | Retailing | 1.06 |
ASIAN PAINTS LIMITED EQ NEW FV Re. 1/- | Consumer Durables | 1.03 |
GRASIM INDUSTRIES LIMITED EQ NEW FV RS. 2/- | Cement & Cement Products | 0.96 |
BAJAJ FINSERV LIMITED EQ NEW FV RE.1/- | Finance | 0.94 |
HINDALCO INDUSTRIES LIMITED EQ NEW FV RE. 1/- | Non - Ferrous Metals | 0.92 |
RELIANCE STRATEGIC INVESTMENTS LIMITED EQ | Finance | 0.92 |
JSW STEEL LIMITED EQ NEW FV RE. 1/- | Ferrous Metals | 0.88 |
ADANI PORTS AND SPECIAL ECONOMIC ZONE LIMITED EQ NEW RS. 2/- | Transport Infrastructure | 0.87 |
BAJAJ AUTO LIMITED EQ | Automobiles | 0.86 |
TECH MAHINDRA LIMITED EQ NEW FV RS. 5/- | IT - Software | 0.85 |
OIL AND NATURAL GAS CORPORATION LIMITED EQ NEW F.V RS.5/- | Oil | 0.82 |
CIPLA LIMITED EQ NEW FV RS.2/- | Pharmaceuticals & Biotechnology | 0.81 |
COAL INDIA LTD EQ | Consumable Fuels | 0.77 |
EICHER MOTORS LIMITED EQ NEW FV RE. 1/- | Automobiles | 0.76 |
HDFC LIFE INSURANCE COMPANY LIMITED EQ | Insurance | 0.75 |
Nestle India Ltd | Food Products | 0.75 |
SBI LIFE INSURANCE COMPANY LIMITED EQ | Insurance | 0.73 |
Shriram Finance Limited | Finance | 0.73 |
APOLLO HOSPITALS ENTERPRISE LIMITED EQ NEW F.V. RS.5/- | Healthcare Services | 0.69 |
Dr. Reddys Laboratories Ltd | Pharmaceuticals & Biotechnology | 0.69 |
WIPRO LIMITED EQ F.V. RS. 2 | IT - Software | 0.64 |
TATA CONSUMER PRODUCTS LIMITED EQ NEW F.V. RE.1/- | Agricultural Food & other Products | 0.63 |
HERO MOTOCORP LIMITED EQ FV RS 2 | Automobiles | 0.6 |
ADANI ENTERPRISES LIMITED EQ NEW FV RE.1/- | Metals & Minerals Trading | 0.53 |
INDUSIND BANK LIMITED EQ | Banks | 0.44 |
Net Current Assets | 0.12 | |
TREPS - Tri-party Repo | 0.01 |
Volatility | 12.47 |
Sharp Ratio | 0.71 |
Alpha | -1.41 |
Beta | 0.99 |
Standard Deviation | - |
Portfolio Turnover | 12.21 |
Time Frame | Period | Fund (%) |
Benchmark (%) |
---|---|---|---|
Best Month | 30-05-2014 | 11.64 | 8.11 |
Worst Month | 31-01-2011 | -10.46 | -10.23 |
Best Quarter | 30-06-2014 | 20.12 | 14.03 |
Worst Quarter | 30-09-2011 | -9.40 | -12.11 |
Best Year | 31-12-2014 | 57.64 | 32.91 |
Worst Year | 30-12-2011 | -22.29 | -23.81 |
Would you like to continue with some arbitrary task?